Website speed, and how to make a website faster
Website Speed is a part of the Search Engines Algorithm affecting SEO/AEO/PPC. It’s essential to understand how to make a website faster.
When M3 build websites, one of the biggest considerations is making sure that they will work for the Search and Answer Engines. Making sure that the User Experience (UX) is a good one will, in turn, let the Search and Answer Engines know that the website is built correctly.
However, we often obtain clients who have had their website built elsewhere, and some are built with best practices in mind, whilst others are frankly not built as well. As a part of the SEO / AEO or PPC Management process, we have to recommend and/or implement changes to help improve website speed. On the rare occasion, we even suggest starting over and building from scratch.
All the hard work put into making a website faster means better SEO / AEO / PPC results, so it is worthwhile understanding what can be done. Below is a screenshot of a few website home pages that we have been working on for a short period of time. There are still improvements to be made, but you can see we have made a real impact already, enough to make a difference in traffic to a website and conversions too.
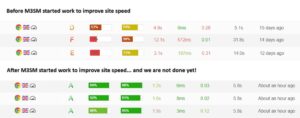
How to make a website faster
The first thing to do is to understand what the search engines think of your website, and to do this, we need to review a few tools, starting with the free one that Google offers, called “Lighthouse”. It is important to note that when you run this, you should do this on an incognito tab, which should mitigate against caching.
Click here for Google Lighthouse
This tool checks one page at a time, so if you are concerned about a specific page or a number of pages on your website, you should run the test on each of them. It also checks either Mobile or Desktop, so to see everything, you need to toggle between the two sets of results.
You should see results for the following:
- First Contentful Paint
- Largest Contentful Paint
- Total Blocking Time
- Cumulative Layout Shift
- Speed Index
First Contentful Paint (FCP)
FCP measures the time it takes for the browser to render the first piece of visible content on a webpage, such as text or an image. It’s a user-centric metric that indicates how quickly a user sees that something is happening on the page after they’ve requested it, improving the perception of site speed. A faster FCP helps reassure visitors that the page is loading, which can reduce the likelihood of them leaving the site.
To improve First Contentful Paint (FCP), focus on making the initial content render faster by minimizing server response times, eliminating render-blocking resources like CSS and JavaScript, and optimising critical assets such as fonts and images. Key strategies include using a Content Delivery Network (CDN), enabling browser caching, minifying HTML, CSS, and JavaScript, and prioritising above-the-fold content.
Largest Contentful Paint (LCP)
LCP measures the time it takes for the largest image or text block in a web page’s viewport to become visible to the user. It’s a key performance metric, part of Google’s Core Web Vitals, that indicates a user’s perceived load speed and the usability of a site. A faster LCP score suggests a better user experience, while a slow one can lead to users leaving the page.
To improve Largest Contentful Paint (LCP), prioritise server performance, optimise the LCP element (often an image) with modern formats (such as .webp) and compression, and reduce render-blocking resources like CSS and JavaScript. Other key strategies include using a Content Delivery Network (CDN), implementing caching, preloading critical assets, and setting appropriate image dimensions.
Total Blocking Time (TBT)
TBT measures the total amount of time a webpage’s main thread is blocked from responding to user input during the page loading process. It is calculated by summing the “blocking time” of all long tasks—those that run for more than 50 milliseconds—between the First Contentful Paint (FCP) and Time to Interactive (TTI). Improving TBT is crucial for website performance and user experience, as a high TBT can lead to a laggy or unresponsive page.
To improve your website’s Total Blocking Time (TBT), you should optimise JavaScript by minifying code, removing unused scripts, and deferring non-critical ones, as well as reduce the main thread’s workload by breaking up long tasks and using Web Workers. Other key strategies include optimising and minifying CSS, using CSS for animations instead of JavaScript, and carefully auditing and reducing the impact of third-party scripts.
Cumulative Layout Shift (CLS)
CLS is a metric that measures how much a webpage’s elements shift unexpectedly during loading, negatively impacting user experience. It’s calculated by multiplying the impact fraction (how much space the element took up) and the distance fraction (how far it moved) for each shift on a page and summing the results over a specific window. A low CLS score is important for a smooth experience, with a target of (0.1) or less.
To improve your website’s Cumulative Layout Shift (CLS), reserve space for content that loads asynchronously by specifying dimensions for images, videos, and iframes. Additionally, avoid inserting content like ads or banners above existing content, use the CSS transform property for animations, and pre-load web fonts or use font-display: swap to prevent text from shifting.
Speed Index
Speed Index measures how quickly content is visually displayed during page load. Lighthouse first captures a video of the page loading in the browser and computes the visual progression between frames. Lighthouse then uses the Speedline Node. js module to generate the Speed Index score.
To improve website Speed Index, focus on optimizing images and media, minifying and compressing code, reducing render-blocking resources, and leveraging browser caching and a Content Delivery Network (CDN). Other effective strategies include improving server response time and deferring non-critical scripts to ensure above-the-fold content loads quickly.
Quick Wins
You may have noticed that each of the elements contain a lot of the same things, but it may seem lengthy and even confusing, so we have detailed what we believe are quick wins. It makes sense to start with the common elements across a website in order to impact not just a page, but the whole website. Common elements are the header and the footer, so here are our thoughts:
- Header Logo: Take a copy of the logo, compress it using a free online compression tool such as compressjpg.com, and then (if your website allows it) convert the compressed image to a .webp (again use a free online tool) and replace
- Social Icons: Often these are much larger than they need to be, so in the first instance make the images as small as the space you are showing them in, and the do as you have done with the header logo
- Footer Accreditations: Again, accreditations that are put into the footer are often very large, so follow the process as per the Social Icons
- Google Tag Manager: Often old, unused Google tags are served within the GTM container that is embedded on your website. Clean this down so that only the used items are still there. It is surprising how many sites are still running Universal Analytics tags in their GTM Container, and every little detail slows a site down
- Minify JS and CSS: This may need a little support through your website developer, but you should be, at the very least, removing unused code and empty lines. This reduces the amount of information that the Search Engines have to wade through, meaning it can crawl more of your website, and place your site better in the Search Engine Results Pages (SERPs)
We know this can be daunting, so if you have any concerns, or need a few hours specialist help, please do not hesitate to make Contact with us. Happy web size reducing!


